Belgian gas bills: among the lowest in Europe!
Les prix du gaz en Belgique sont en hausse considérable depuis 2021. Auparavant, la facture de gaz des Belges étaient l’une des moins élevées d’Europe. Est-ce toujours le cas aujourd’hui ? Analyse, comparatifs et conseils : découvrez ce que cela implique pour vos finances.
Points clés :
- Le prix du gaz en Belgique est 33 % moins cher qu’aux Pays-Bas.
- Le niveau des surtaxes dans le prix du gaz en Belgique est faible par rapport aux pays voisins.
- La part du coût de l’énergie dans le prix du gaz est grande en Belgique.
Tous les mois, le régulateur fédéral (CREG) et les régulateurs régionaux (VREG, CWaPE et Brugel) publient un tableau de bord comparant les prix de l’énergie en Belgique par rapport à ceux des pays voisins.
Pour le mois de janvier 2022, la CREG a ainsi mis en exergue que la facture de gaz des Belges (3781,81 euros) est en moyenne bien plus avantageuse que celle de nos voisins néerlandais (5706,75 euros). Nous sommes cependant moins bien lotis que les ménages français (2857,20 euros) et britanniques qui, de leur côté, bénéficient de la facture de gaz la plus basse (1419,23 euros).
On notera toutefois que les conclusions divergent lorsque l’on regarde le détail par Région belge. Ainsi les Flamands déboursent pour le gaz 3643,33 euros par an, alors que les Bruxellois paient environ 3751,50 euros et que les Wallons doivent s’acquitter de 3950,59 euros.
Comment expliquer une telle disparité entre les pays concernés par l’étude, voire même entre les Régions ? Que faire si votre facture est plus élevée que la moyenne belge ? Quels sont vos leviers d’influence ? Comparateur-Energie.be a fait son enquête.
Comprendre sa facture : de quoi est composé le prix du gaz ?
Pour bien comprendre d’où viennent les différences observées entre pays, il faut d’abord comprendre la composition d’une facture de gaz. Et ce n’est pas une mince affaire ! La principale difficulté vient du fait que chacun des pays observés intègre des considérations différentes dans le calcul du prix final facturé. Néanmoins, il est possible d’observer 4 grandes composantes qui reviennent systématiquement :
Le prix de l’énergie
Il s’agit du prix de la molécule d’énergie à proprement parler. Il est librement déterminé par les fournisseurs et varie donc de l’un à l’autre. C’est la seule des quatre composantes qui peut être négociée en fonction des besoins du client.
La TVA
Aucun des pays observés n’échappe à la taxe sur la valeur ajoutée. Dès lors que l’on commercialise un service ou un bien à des particuliers, une TVA s’applique. Néanmoins, son pourcentage n’est pas le même d’un pays à l’autre, ce qui peut créer des différences notables.
Les coûts de réseau (transport et distribution de l’énergie)
Cette composante permet de rémunérer les gestionnaires de réseau de transport (GRT) et de distribution (GRD). Contrairement au prix de l’énergie, les coûts de réseau sont non négociables. En Belgique, ils doivent être approuvés par les régulateurs fédéral et régional dont il dépend. Notons qu’ils fluctuent d’une zone géographique à l’autre, en fonction de nombreux critères, tels que la densité de population ou les lois.
Les autres coûts
Tous les autres coûts ou taxes sont regroupés dans cette catégorie. Cette dernière composante varie grandement d’un pays à l’autre en fonction de leurs politiques énergétiques. Il est donc compliqué de détailler avec exactitude les postes de coûts qu’elle reprend. En Belgique, cette catégorie comprend les redevances et les surcharges, comme par exemple tout ce qui concerne les investissements dans l’énergie renouvelable.
>> En savoir plus sur le prix du gaz
Composantes d’une facture de gaz dans les trois Régions belges

Le prix du gaz naturel pour les clients résidentiels : la Belgique VS les pays voisins
Entre le deuxième semestre 2020 et le deuxième semestre 2022 (dernières données disponibles), la facture annuelle de gaz des Belges avait augmenté de 133 %. Les causes seraient d’origine conjoncturelle. Il y a bien sûr eu la reprise des activités après la crise sanitaire, mais aussi, les conditions météorologiques peu favorables au printemps et en été.
Pourtant, lorsque l’on compare la Belgique avec les pays voisins, les prix du gaz au MWh enregistrés au cours du premier semestre 2021 ne sont pas les plus élevés chez nous.
Premières observations

| Prix moyen par MWh | |
| Belgique | 51 € |
| Allemagne | 63 € |
| France | 68 € |
| Pays-Bas | 95 € |
| Royaume-Uni | 41 € |
Regardons plus en détail les résultats de l’étude des régulateurs. On remarque d’emblée une chose : toutes les composantes de la facture sont généralement moins élevées en Belgique que pour les autres pays, à l’exception du Royaume-Unis.
Pour la composante énergie, la Flandre est à égalité avec le Royaume-Unis. En revanche, nous avons des taxes plus élevées que les leurs. Mais les grands gagnants en terme de taxes sont les Pays-Bas.
Si on s’attarde d’ailleurs plus particulièrement sur la composante des coûts de transport et de distribution, on observe que les différences sont peu marquantes entre les pays, à l’exception des Pays-Bas. Les ménages néerlandais bénéficient effectivement de très faibles coûts de réseau, mais en contrepartie, ils sont assommés de surcharges.
Quel fournisseur d’énergie vous convient le mieux ?
Faites un comparatif pour le savoir !
Une composante de l’énergie élevée et moins de taxes
Voici donc à quoi ressemblent les prix du gaz moyens pour chaque pays en termes de proportions :

On observe donc qu’en 2021, la composante énergie de la facture de gaz reste la plus élevée de tous les postes de coûts, représentant en moyenne 28 à 51% de son montant total. Concernant les coûts de réseau, ils sont tous relativement élevés, variant entre 23 et 32% du montant total de la facture, sauf pour les Pays-Bas qui affiche un taux ne dépassant pas les 7%.
Enfin, en termes de taxes, les Royaume-Unis affichent le taux le plus faible avec une TVA représentant seulement 5% du montant de la facture finale contre 17% dans les autres pays.
Des politiques énergétiques différentes
Les raisons derrière de telles différences de prix sont complexes et dépendent de nombreux facteurs. Néanmoins, nous tenterons d’apporter des pistes d’explications à ces disparités. Celles-ci ne sont pas exhaustives.
Tout d’abord, il faut bien comprendre que la provenance du gaz qui circule dans les réseaux européens n’est pas la même partout. En Belgique par exemple, on ne produit pas de gaz naturel, on l’importe. Et suivant son lieu d’origine, les prix fluctuent. Toutefois, le pays possède un avantage conséquent : le port de Zeebrugge. Il agit comme une plaque tournante de la route du gaz internationale. Cela permet aux fournisseurs d’énergie d’acheter du gaz à des prix compétitifs. Par répercussion, les consommateurs belges en profitent également.
Au Pays-Bas, le niveau des taxes a drastiquement augmenté ces dernières années afin financer la transition vers les énergies renouvelables. Cela explique pourquoi le prix du gaz atteint un tel niveau. On peut cependant s’étonner du coût de la composante énergie, alors que le pays produit son propre gaz.
Au Royaume-Uni, les politiques sont plus libérales. Les Britanniques sont nettement moins taxés que leurs comparses européens, tandis qu’ils payent sensiblement la même chose qu’eux pour la molécule de gaz et l’entretien des réseaux.
En France, malgré un marché libéralisé depuis 2007, peu de fournisseurs font le poids face à Engie et EDF, les fournisseurs historiques du pays. Cela pourrait expliquer pourquoi il y a peu de pression sur les prix de la composante énergie.
Belgique : des prix qui n’en finissent pas de monter
Si les prix du gaz en Belgique et en Europe ont connu une baisse considérable en 2020, on ne peut pas en dire autant de 2021. En effet, comme expliqué en début d’article, la reprise des activités économiques post-confinement a fait du mal au marché de gros de l’électricité et du gaz et par conséquent, aux portefeuilles des ménages Belges.
Mais, pourquoi une telle inflation en moins d’un an ? Outre la reprise du secteur économique, on remarque une hausse du prix de la tonne de CO2, qui, par conséquent, augmente les coûts de production de l’énergie. La diminution du stockage de gaz en Europe est également un facteur important puisqu’aujourd’hui, le continent est considéré comme importateur et non plus exportateur de gaz, ce qui exerce une pression sur ses tarifs. Le Brexit n’a pas non plus facilité les connexions entre l’Union Européenne et les Royaume-Unis. Enfin, les récents conflits entre la Russie et l’Ukraine ont jouer un rôle majeur dans l’inflation des prix.
>> Augmentation des prix de l’énergie sur le marché de gros : un risque pour nos factures
Comparez les offres d’énergie et réduisez votre facture !
Que faut-il faire profiter obtenir un meilleur prix ?
Si votre contrat arrive à échéance, la meilleure stratégie à adopter est de comparer votre contrat d’énergie. Pour ce faire, vous pourrez faire confiance aux comparateurs mis en place par les régulateurs nationaux et régionaux tels que le CREG Scan ou encore, le Compa CWaPE. N’hésitez pas non plus à utiliser les comparateurs de prix certifiés tels que Comparateur-Energie.be, premier site de comparaison des prix de l’énergie a avoir été labelisé par la CREG.
>> Lire aussi : Comment changer de contrat d’énergie ?
Découvrez les promotions des fournisseurs d’énergie !
Comparez les prix de l’électricité et du gaz et changez gratuitement de fournisseur directement sur notre site en 5 clics seulement.
Ce qu’il faut retenir
Les Belges se trouvent dans une situation relativement confortable vis-à-vis du prix du gaz, en comparaison à nos pays voisins tels que les Pays-Bas. En effet, notre pays impose peu de surtaxes sur le prix du gaz, ce qui nous permet d’avoir une plus grande influence sur le prix de l’énergie.
Cependant, la hausse des prix de l’énergie nous concerne tous. Il faut donc rester vigilant et prendre le temps d’analyser votre facture et votre contrat en cours avant de le changer.
Découvrez les promotions des fournisseurs d’énergie !
Comparez les prix de l’électricité et du gaz et changez gratuitement de fournisseur directement sur notre site en 5 clics seulement.
Source :
Remarques supplémentaires : rappel de la situation en Belgique
Rappelons quelques informations utiles concernant le marché du gaz naturel sur notre territoire.
Quelle est la consommation moyenne de gaz d’un ménage belge ?
La consommation de gaz moyenne d’un ménage belge équivaut à environ 17.000 kilowattheures (kWh) par an. Mais vous avez peut-être l’habitude de visualiser votre consommation de gaz en termes de volume, c’est-à-dire mesurée en mètre cube (m3). Pour convertir une unité à l’autre, il faut compter que 1 m3 comprend entre 9,53 en 12,79 kWh. Cela dépend de son pouvoir calorifique.
L’étude commanditée par les régulateurs citée dans cet article se base donc sur cette consommation de base. Pour rendre la comparaison pertinente, elle pose comme hypothèse qu’elle est identique dans les pays voisins.
Quel est le prix moyen du gaz naturel en Belgique ?
Le tarif du gaz varie selon les différents types de contrats et selon les fournisseurs. Ceux-ci les déterminent chaque mois sur base de l’évolution du marché. Pour en savoir plus, vous pouvez consulter notre dossier à ce sujet.

Also read on our blog
Switching supplier, benefiting from the competition and therefore potentially paying less is possible today for all consumers. Tha…

“100% green electricity” is what most energy suppliers offer. Yet this term encompasses subtleties that are sometimes more grey th…
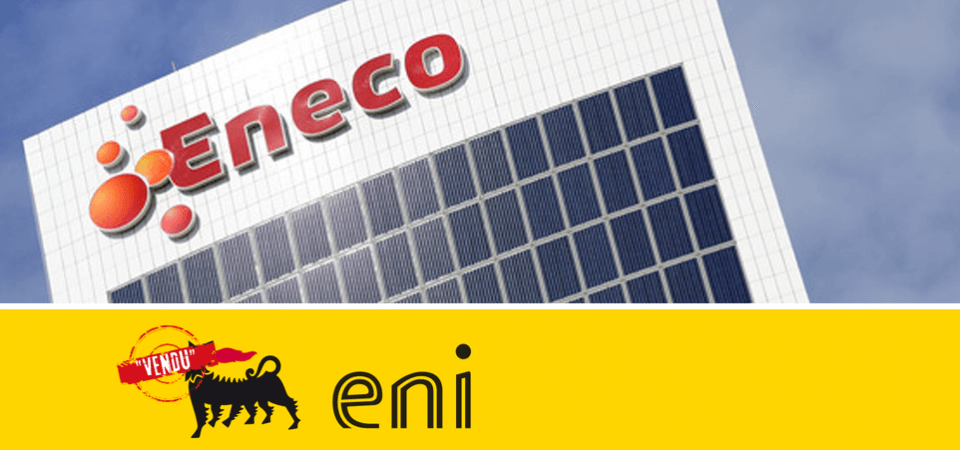
Eni Gas & Power, the Belgian subsidiary of the Italian supplier, has been bought by the Dutch energy supplier Eneco. What does…

“We’re not suckers!” - It’s a fact of life that people don’t like paying too much, especially for their energy bills. That’s why y…